Statistics for decision-makers
Regression to the mean: the most expensive statistical mistake in management
Your worst performers improve after a warning. Your best performers slip after praise. It looks like feedback works one way and not the other. Most of the time, it is neither.
In the 1960s, the psychologist Daniel Kahneman was teaching Israeli Air Force flight instructors about the psychology of training. He told them that rewarding good performance works better than punishing mistakes. One experienced instructor pushed back. In his experience, when he praised a cadet for a clean manoeuvre, the next attempt was usually worse. When he shouted at a cadet for a bad one, the next attempt was usually better. So, he concluded, praise hurts and criticism helps.
His observation was correct. His explanation was wrong. Kahneman later called that moment one of the most satisfying of his career, because it showed how a purely statistical effect can disguise itself as cause and effect. The effect has a name: regression to the mean. Once you see it, you notice it in performance reviews, store rankings, marketing reports and almost every "before and after" slide.
The idea in one sentence
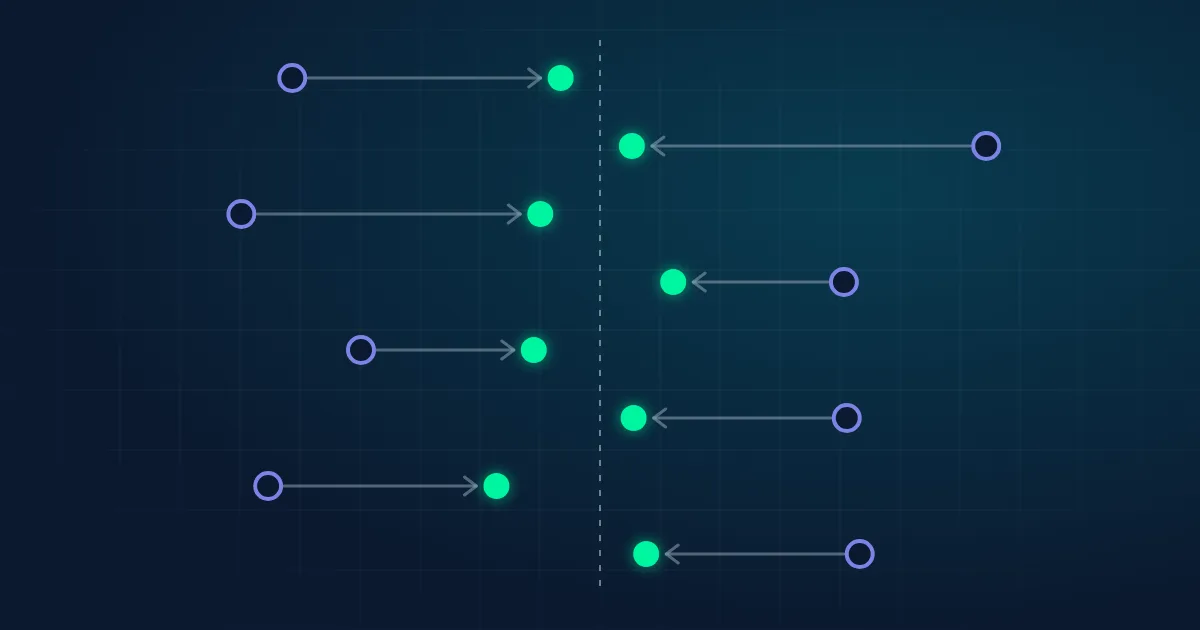
Any measured result is part skill (something stable that will still be there next time) and part luck (everything that will not repeat). When you pick out the most extreme results, you also pick out the ones with the most extreme luck. Luck does not repeat, so next time the same people or units drift back towards the average, even if nothing about them has changed.
The flight instructor only praised cadets after their best attempts and only shouted after their worst ones. An unusually good landing usually includes some good fortune, so the next one tends to be closer to that cadet's normal level, which looks like a drop. An unusually bad landing includes some bad fortune, so the next one tends to look like an improvement. The praise and the shouting did not have to do anything at all.
See it happen: a sales team with no management at all
The simulation below builds a team of 20 salespeople. Each one has a fixed true skill level that never changes. Each month, their result is that skill plus some random luck. We rank everyone on month 1, label the bottom five "scolded" and the top five "praised", and then look at month 2.
Nobody is actually scolded, praised, coached or fired. The model does not even know those words. Use the slider to change how much of a month's result comes from luck.
At 0% luck, nothing moves: the people who were best in month 1 are the best in month 2 by exactly the same margin. As luck increases, the "scolded" group improves more and the "praised" group falls back more. At 90% luck, the month 1 ranking is almost worthless, and both groups land close to the team average.
One run can be noisy, so the readout also shows the average over 2,000 simulated teams. The direction is the same every time.
How big is the effect? A rule of thumb
You do not need a simulation to estimate how much regression to expect. You need one number: the correlation between two periods, usually written r. It measures how well this month's result predicts next month's. If results were pure skill, r would be 1. If they were pure luck, it would be 0.
average + r × (this period − average)
Example: a store sells 30 units a day more than the chain average this quarter, and quarter-to-quarter correlation is 0.4. The best guess for next quarter is 0.4 × 30 = 12 units above average. A "drop" of 18 units is the expected outcome, not a warning sign.
In our simulation, the luck slider sets r directly: with 50% luck, r is 0.5, so a group that was 20 points above average is expected to be about 10 above average next month. In real data, you estimate r from history: take two comparable periods and correlate the results.
Where it costs real money
1. Performance management
Rank people on one quarter, put the bottom tenth on an improvement plan, and the plan will appear to work, because a large part of the bottom tenth was simply unlucky. Meanwhile, last quarter's stars "lose their edge" and nobody can explain why. Bonuses, promotions and dismissals end up rewarding variance.
2. Fixing the worst units
A chain selects its ten weakest branches for a new programme: new signage, extra training or a consultant. Next quarter, those branches improve, and the programme is declared a success. Without a comparison group of similarly weak branches that did not get the programme, it is impossible to say how much of that improvement would have happened anyway.
3. Reacting to a bad month
Campaigns get changed, prices get cut and suppliers get replaced right after an unusually bad month. The next month is usually better, so the change looks like the fix. The same logic runs in reverse after a record month: the "slump" that follows is often just the absence of the luck that made it a record.
4. The famous "jinxes"
Athletes who appear on magazine covers after an exceptional season, the "sophomore slump" of a strong debut, the CEO named "manager of the year" whose company then underperforms: many of these stories are regression to the mean with a narrative attached. The cover did not cause the decline. The exceptional season that earned the cover was partly luck.
5. Before-and-after studies
In medicine, patients tend to seek treatment when their symptoms are at their worst, so they would often improve with any treatment, or none. This is one reason clinical trials use control groups. Business "pilots" deserve the same discipline, and they rarely get it.
How to protect your decisions
- Don't select on a single extreme result. Judge people and units on several periods, or on a rolling average, before acting. Extremes based on one period are the most luck-heavy numbers you have.
- Estimate how much your metric repeats. Correlate two comparable periods. If r is low, rankings based on one period are closer to a lottery than a league table, and you should expect strong regression.
- Use a comparison group. If you intervene on the worst performers, keep a similar group that gets no intervention, ideally chosen at random. The improvement that matters is the difference between the two groups, not the before-and-after change.
- Shrink extreme estimates towards the average. When you forecast next period from this one, pull extreme values in proportion to r, as in the rule of thumb above. More advanced versions of this idea (empirical Bayes and multilevel models) are standard tools for ranking sales reps, stores or products fairly.
- Be most suspicious of the stories you like. "Our programme turned the worst branches around" and "she lost her edge after the promotion" are both satisfying. They are also exactly what regression to the mean produces on its own.
A good rule for any before-and-after chart: ask how the units on it were chosen. If they were chosen because they were extreme, part of the change you see was guaranteed before anyone did anything.
The takeaway
Regression to the mean is not a rare statistical curiosity. It happens wherever results mix skill and luck, which is almost everywhere in business. It is expensive because it supports the decisions people already want to make: tough feedback seems to work, special programmes seem to work, and stars seem to be fading. Separating the part of a result that will repeat from the part that will not is the first step towards decisions that hold up.
Sources and further reading
- Kahneman, D. (2011). Thinking, Fast and Slow. Farrar, Straus and Giroux. Chapter 17, "Regression to the Mean" (the flight instructor story).
- Galton, F. (1886). Regression towards mediocrity in hereditary stature. Journal of the Anthropological Institute of Great Britain and Ireland, 15, 246–263.
- Barnett, A. G., van der Pols, J. C., & Dobson, A. J. (2005). Regression to the mean: what it is and how to deal with it. International Journal of Epidemiology, 34(1), 215–220.